

The Client
Novem Digital is a technology company focused on enterprise asset management and operational risk. Their clients — facility managers, operations teams, and capital planners — need real-time visibility into the health and risk profile of physical sites: buildings, infrastructure, and industrial assets.
Before working with Zulbera, Novem's data lived in disconnected systems. Risk assessments happened in spreadsheets. Predictive insights were trapped in specialized tools that did not talk to each other. Capital planning was a separate process entirely, divorced from the real-time health data that should have informed it.
The Challenge
Novem needed a single, integrated platform that could unify data from ScriptString's Enterprise Asset Advisor, BigWave sensors, and other sources into one coherent picture. The platform had to accomplish three things simultaneously:
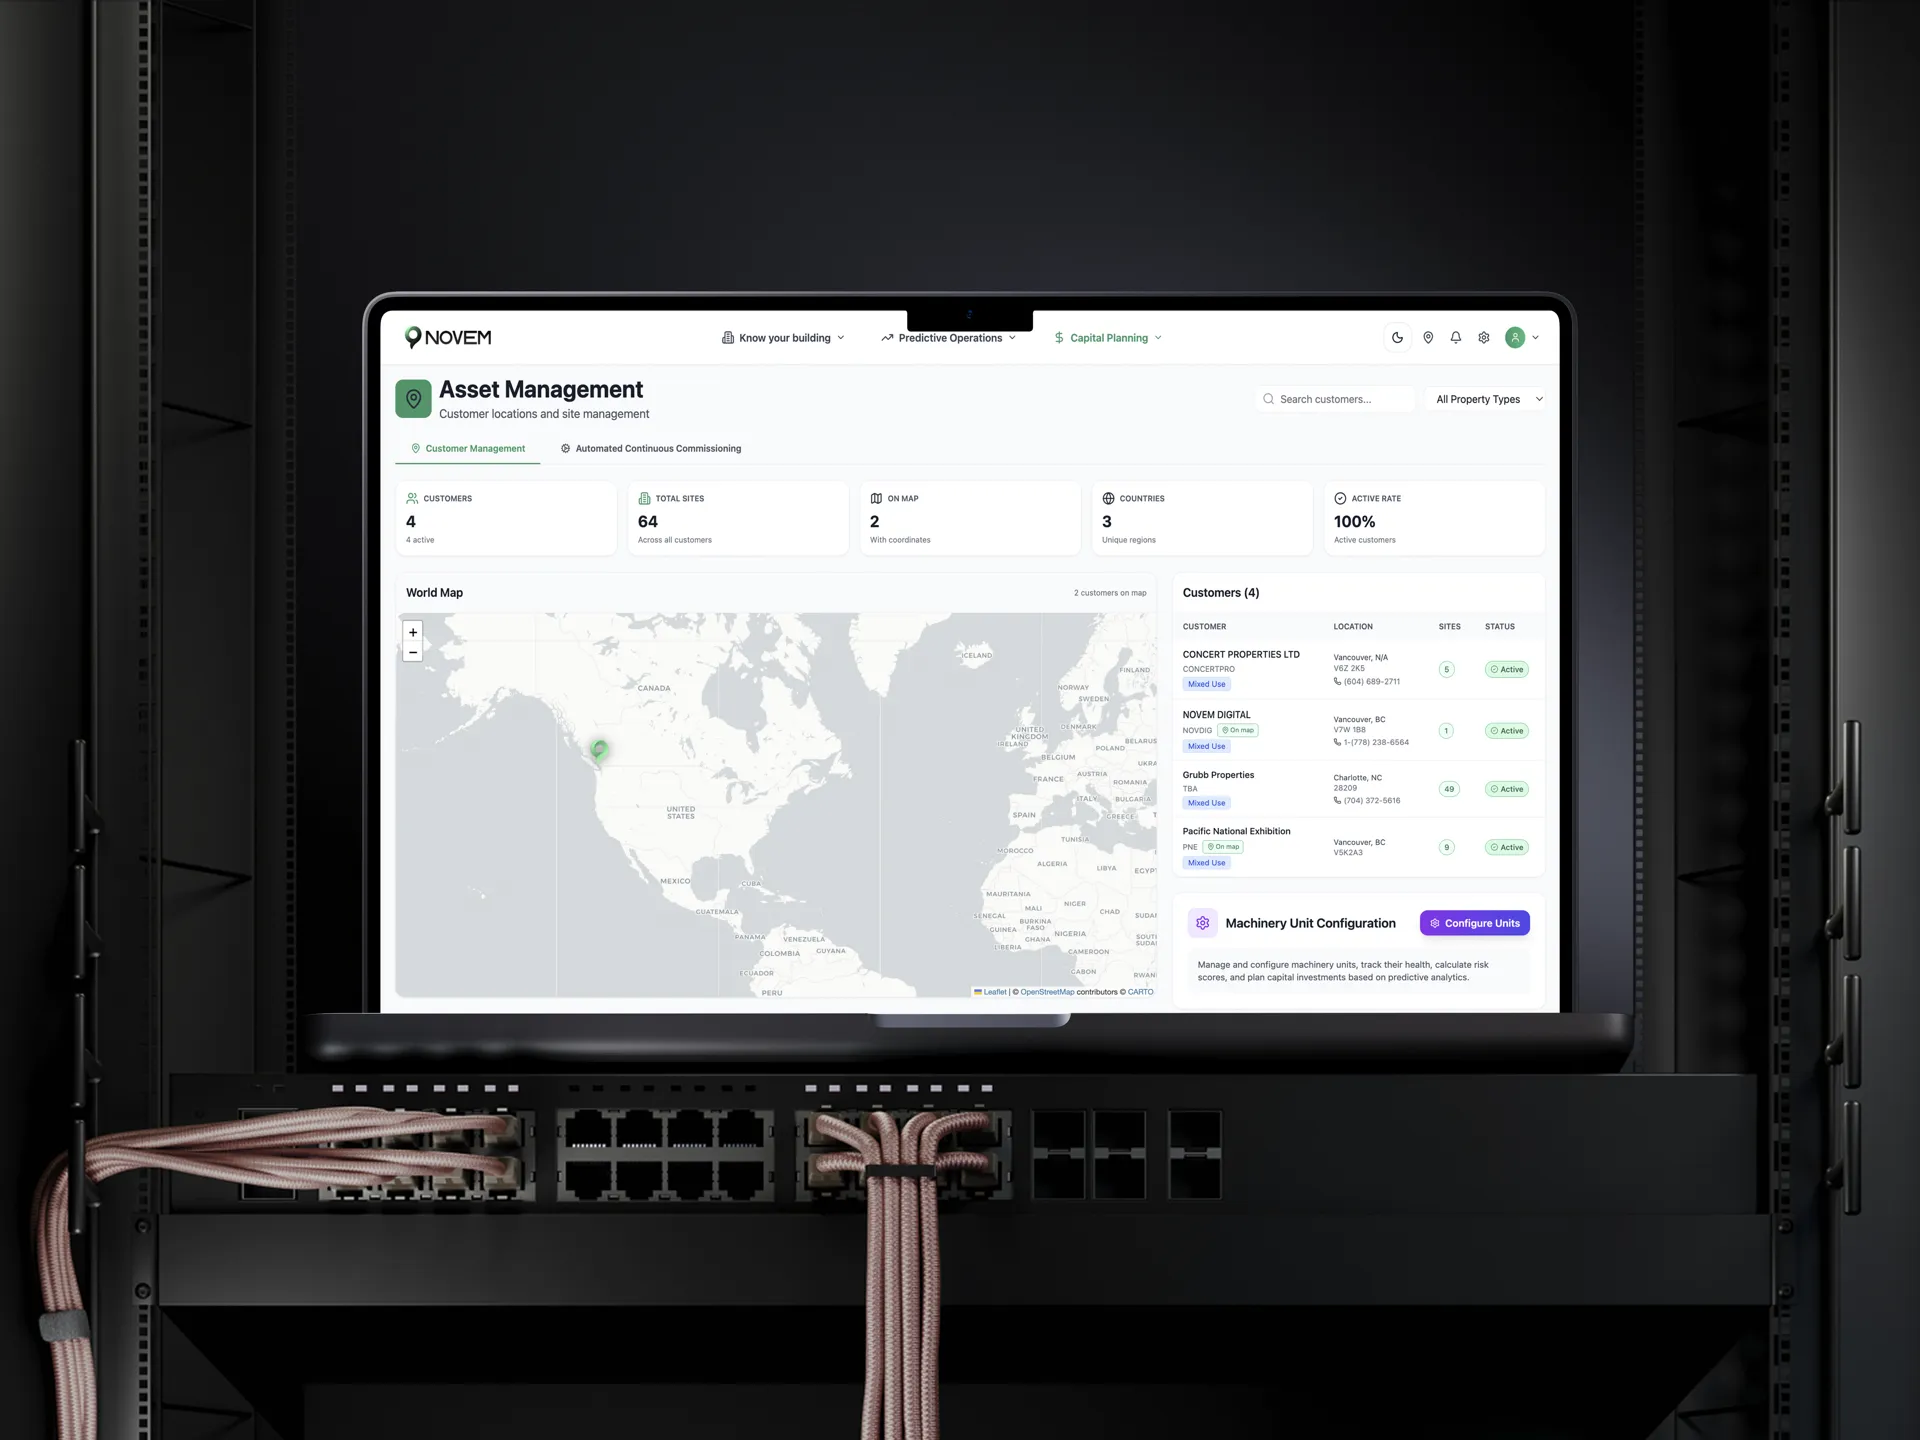
- Site Health Monitoring — Real-time dashboards showing the current state of every asset, with a consistent risk language (0-100 score, Green/Yellow/Red) that operations teams could act on immediately.
- Predictive Operations — Modules for Arc Flash, Wildfire, Transformer failure, Mechanical risk, and Water Leak detection that could surface risks before they became incidents.
- Capital Planning — A financial layer that connected risk data to budget decisions, helping planners prioritize investments based on actual asset health rather than scheduled replacement cycles.
The technical complexity was significant. The platform needed to ingest heterogeneous data formats, normalize them into a consistent risk model, run scoring algorithms in real time, and present everything through embedded analytics (Superset), interactive maps, and response protocols — all while maintaining the security posture that enterprise clients demand.
Our Approach
We treated this as an infrastructure problem first. Before writing any UI code, we spent two weeks defining the data model, API contracts, risk scoring algorithm, and integration architecture. This upfront investment prevented the expensive mid-project pivots that plague enterprise software projects.
Phase 1: Discovery & Architecture (2 weeks)
We mapped every data source — ScriptString EAA, BigWave sensors, manual inspection reports — and designed a normalization layer that could ingest all of them into a unified schema. The risk scoring engine was designed to be configurable: weights, thresholds, and scoring rules could be adjusted per client without code changes. We defined the 0-100 score system with Green (0-33), Yellow (34-66), and Red (67-100) zones, creating a consistent risk language that every stakeholder could understand regardless of their technical background.
Phase 2: Core Platform (8 weeks)
The frontend was built with React 19 and TypeScript, using TanStack Query for server state management and Recharts for data visualization. We chose React 19 specifically for its improved concurrent rendering capabilities — critical for a dashboard that displays dozens of real-time data streams simultaneously without janking the UI.
The backend runs on Express/Node.js with a clear separation between the data ingestion layer, the risk scoring engine, and the API surface. The data layer normalizes incoming data from ScriptString and BigWave into a canonical format, applies tenant-scoped access policies, and feeds the risk engine. API endpoints are versioned and documented, with health checks that operations teams can monitor independently.
Embedded analytics use Apache Superset, integrated directly into the React dashboard so users never leave the platform to access deeper analytical views. Interactive maps provide geospatial context for risk data — showing which buildings, sites, or regions carry the highest risk profiles at a glance.
Phase 3: Predictive Modules & Capital Planning (4 weeks)
With the core platform stable, we built five predictive modules: Arc Flash risk assessment, Wildfire exposure analysis, Transformer failure prediction, Mechanical system degradation tracking, and Water Leak detection. Each module follows the same pattern — ingesting specialized data, running its scoring algorithm, and surfacing results through the unified dashboard with the same Green/Yellow/Red language.
The "Know Your Building" layer adds sensor integration for vibration, weather, decibel, air quality, and energy monitoring. This IoT data feeds directly into the risk engine, providing real-time environmental context that improves the accuracy of predictive models.
Capital planning connects risk scores to financial decision-making. Operations teams can see not just which assets are at risk, but what the cost of remediation looks like and how to prioritize investments across their entire portfolio. Machinery risk configurations allow planners to model different scenarios and their budget implications.
Phase 4: Integrations & Launch (2 weeks)
The final phase focused on production hardening. Superset embedding was optimized for performance, ensuring analytical views load within acceptable thresholds even with large datasets. Security was implemented at every layer: Helmet for HTTP headers, CORS policies, rate limiting on all API endpoints, and comprehensive audit logging that satisfies enterprise compliance requirements.
Technical Architecture
Key Decisions & Trade-offs
Why React 19 over Next.js: This is a dashboard application, not a content site. Server-side rendering and SEO were not priorities — real-time data rendering and concurrent updates were. React 19's concurrent features gave us the performance characteristics the platform needed without the overhead of a full meta-framework.
Configurable risk engine: We invested extra time making the scoring algorithm configurable rather than hard-coded. This decision paid off immediately when Novem's first enterprise client needed different risk thresholds for their specific asset types. Configuration changes that would have required code deployments became admin panel adjustments.
Embedded Superset vs. custom analytics: Building custom analytics dashboards would have consumed months of additional development. Embedding Superset gave Novem's clients powerful, familiar analytical tools while keeping our scope focused on the platform-specific features that create differentiation.
Results
The Novem Digital Risk Platform was delivered on schedule in 4 months. The platform unifies five predictive modules, embedded analytics, interactive maps, and capital planning into a single interface — giving operations teams and planners a complete picture of site health and risk for the first time.
The configurable risk engine supports multiple client configurations from the same codebase. The architecture is ready for sensor expansion and AI-driven insights, with clear integration points for future IoT data sources and machine learning models.
Project Timeline
Discovery & Architecture
Defined risk model, health matrix, integration scope with ScriptString EAA and BigWave. Designed database schema, API contracts, and scoring algorithm.
Core Platform Development
Built React 19 dashboard with TanStack Query and Recharts. Express/Node backend with risk engine, data normalization layer, and health endpoints. Embedded Superset analytics and interactive maps.
Predictive Modules & Capital Planning
Arc Flash, Wildfire, Transformer, Mechanical, and Water Leak modules. IoT sensor layer for vibration, weather, decibel, air quality, and energy. Capital planning with machinery risk configuration.
Integrations & Launch
Superset embedding optimization, security hardening with Helmet, CORS, and rate limiting. Comprehensive documentation for operations and compliance teams.
A single, integrated platform for site health, predictive operations, and capital planning — exactly what we needed.
Novem Digital
Client
Lessons Learned
Invest in the data model early. The two weeks we spent on discovery and architecture paid for themselves many times over. Every team member — frontend, backend, and integrations — had a shared understanding of the data model before writing a line of production code. This eliminated the integration surprises that typically consume weeks in enterprise projects.
A consistent risk language matters more than precision. The 0-100 score with Green/Yellow/Red zones became the lingua franca of the entire platform. Operations teams, executives, and planners all understood the same language, which dramatically reduced the communication overhead around risk decisions.
Configurability is not over-engineering when enterprise clients are the audience. Every enterprise client has slightly different needs. Building configuration into the scoring engine, thresholds, and module weights from the start meant Novem could onboard new clients without Zulbera writing custom code for each one.